
Alexey Potapov, Attack Detection Department Expert, PT Expert Security Center, Positive Technologies, explores the rising potential for Behavioural Anomaly Detection to support cybersecurity specialists.
Security information and event management or SIEM can detect attacks in different ways including building chains of launched processes based on normalized events, automated whitelisting, and machine learning (ML) to detect suspicious user behaviour and infrastructure processes. The Behavioural Anomaly Detection (BAD) module is nothing new. It works as a second opinion system, collecting data about events and users, assigning them a risk score, and generating an alternative opinion based on its algorithms. BAD reduces the cognitive load on SIEM system analysts so they can make more informed decisions about information security incidents.
In this article, we’ll discuss what elevates BAD from “just another tool” to an indispensable force on your cybersecurity team capable of doing things you never could before.
Event risk scoring in BAD
At the heart of the BAD module is how it scores event risks to ensure the early detection of potential threats using ML algorithms. Each event is assigned a risk score based on an analysis and comparison of behavioural patterns against normal activity.
At the centre of the module and the most important thing BAD does is operating system process analysis. Risk scoring is based on the idea that the root cause of most cyberthreats in internal infrastructure is operating system processes. They are how attackers actually carry out their plans.
The way BAD scores risks is different than in user and entity behaviour analytics (UEBA) systems and other similar solutions. Risk scoring in the BAD module begins when it receives events from operating systems and applications, each of which it analyses using a variety of atomic machine learning models designed to study different aspects of the same events and processes. This approach ensures that all scores reflect a multifaceted assessment.
Atomic models are particularly interesting because they analyse individual features of events, allowing the same event to be assessed from different angles. For example, one model might focus on identifying rare or unique processes, while another looks at communication with network resources. Thanks to BAD’s native ability to search and combine different types of events (for example, to create a data set that looks for an anomalous process logging into the operating system or application), we were able to use the verdicts of such models in BAD’s general process profiler. Without combining such events in the same data set, we wouldn’t be able to use models that analyse operating system and application access.
Each atomic model has a certain weight (significance) to calibrate the final risk score more accurately. Model triggers are aggregated for each globally unique identifier (GUID) taking into account process launch event models and the numerous other events in which the process participates. This provides a diverse context of the process’ interactions with the system, including all associated process sequences in the chain.
Indicators of behaviour
BAD moves beyond traditional threat detection methods that rely on specific attacker tools or artifacts (attack indicators, IP addresses, hashes). Attacker indicators of behaviour (IoB) are a key element in this process, as they comprise long-term rules that are difficult to bypass and provide important information for analysis when triggered.
BAD includes a group of specialized IoB rules that are activated when certain conditions are met during process analysis. These indicators are triggered when anomalous or suspicious activity is detected in a process’ GUID based on behavioural models.
Indicators of behaviour have one main job: expose the strategy and goals of attackers by analysing sequences of actions that form malicious patterns and stand out compared to ordinary behaviour on the network. IoB serve as a signal that investigation is needed and lead to the generation of alerts sent automatically to MaxPatrol SIEM, our central security information and event management system. The final risk score for each process and its chain is formed by aggregating the weight scores of the models triggered when detecting indicators of behaviour. This risk score can be used to prioritize events so SIEM system analysts can focus only on the most critical and suspicious events. Indicators of behaviour can also be used to make advanced correlation or enrichment rules that provide more accurate and comprehensive threat detection.
Figures 1 and 2 show how the process profile and its risk score are formed.
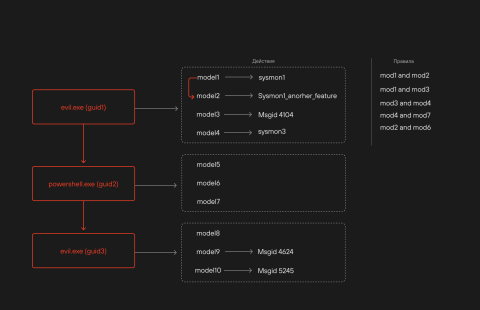
Figure 1. How a process profile is formed
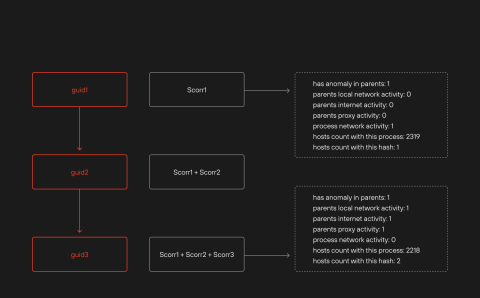
Figure 2. How a process risk score is formed
From theory to practice: detecting cyberattacks with BAD
Almost all alerts generated in the SIEM system are sent to the BAD module to enrich them with the same risk score requested through the event card snippet (Fig. 3). This allows MaxPatrol SIEM analysts and operators to use the bad.risk_score field when writing correlation or enrichment rules, as well as in the event filter (for example, to sort and search for the most anomalous triggers).
BAD can detect the following cases:
- Complex targeted attacks and attacks that bypass correlation rules.
- New tactics, techniques, and procedures not yet covered by detection rules.
- Post-exploitation after the exploitation of a previously unknown vulnerability.
- Accidental or excessive whitelisting (when users themselves whitelist certain correlation rules).
Case 1. BAD for second opinions and ranking triggered correlation rules using bad.risk_score
One great thing about BAD is that it helps analysts evaluate correlation rule triggers. The risk score in the triggered correlation rule’s event card can be the deciding factor in confirming a true positive or false positive. Figure 3 shows an example of a triggered correlation rule with importance = high. However, BAD analysed the activity of the process that triggered the rule and assigned the event a low risk score. This correlation likely has a low significance level, and the positive is actually a false positive.
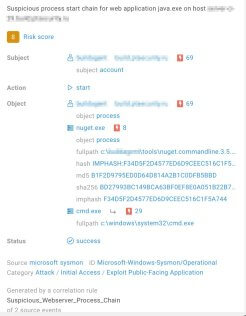
Figure 3. Correlated event card with a risk score from BAD
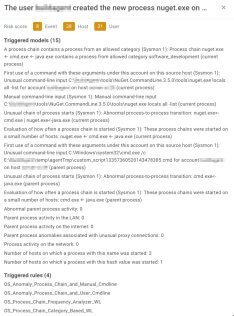
Figure 4. Triggers of ML models and indicators of behaviour
Now let’s check out which alerts with an enriched bad.risk_score were sent to MaxPatrol SIEM preceding interactive attacks (Fig. 5), and which triggers have a risk score above 50 and 100 (Fig. 6 and 7).
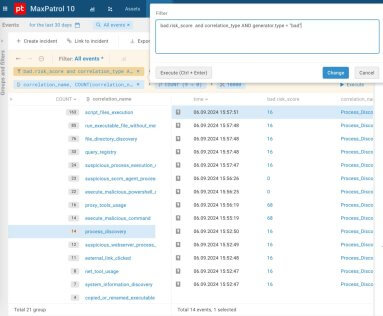
Figure 5. List of triggered correlation rules with an enriched risk score from BAD
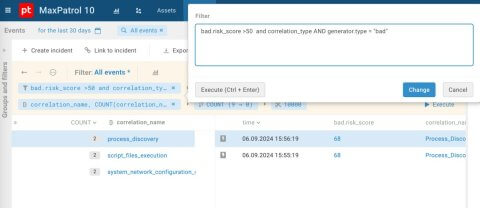
Figure 6. Search for correlation rules with risk scores above 50
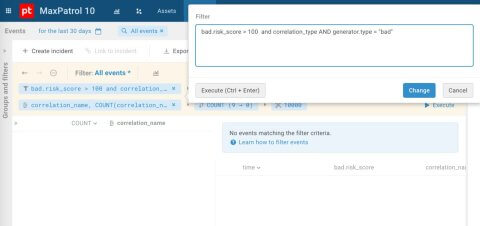
Figure 7. Search for correlation rules with risk scores above 100
Figures 6 and 7 show that in MaxPatrol SIEM, after filtering the positives by bad.risk_score, only a small number of triggers with a score over 50 remain and no triggers over 100.
Now let’s look at two real interactive attacks[1] from the Standoff cyberexercise. We’ll start with triggered models and indicators of behaviour in the BAD module in MaxPatrol SIEM and explain how we discovered these incidents.
Case 2. BAD as a second opinion system
Let’s consider an incident where the malicious gostbypass.exe file is launched on a user’s workstation. The file functions as a SOCKS proxy and is used to develop the attack further, but the malware itself doesn’t generate any processes. The attackers conduct reconnaissance of the domain network and gain access to several servers and applications. The chain of events is shown in Figure 8.
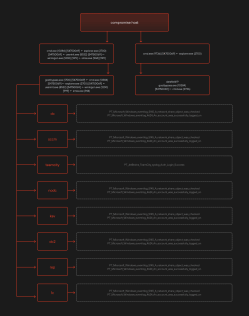
Figure 8. gostbypass.exe activity
Several correlation rules were triggered with a low level of importance (Fig. 9), but the BAD module had an alternative opinion after analysing the behaviour profile of the gostbypass.exe process as whole. Operators can check the risk score card and confirm BAD’s score (Fig. 10), and the activity will not be part of the subsequent training of models. Figure 11 shows which ML models and indicators of behaviour were triggered.
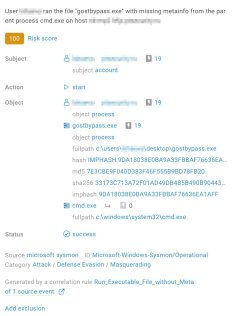
Figure 9. Correlation between high risk scores and the “info” importance level
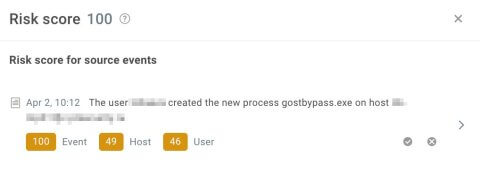
Figure 10. Risk score confirmation

Figure 11. Triggers of ML models and IoB in the snippet from BAD
The BAD module used its machine learning algorithms to analyse the data flow from the compromised user’s workstation. During analysis, the module identified unusual patterns in the sequences and behaviour of processes (Fig. 12) based on an integrated group of atomic models and indicators of behaviour. Deviations from the baseline profile of normal behaviour according to these models influenced the increase in risk score, which signalled the system about potential malicious activity.
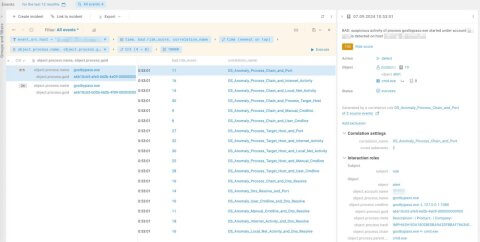
Figure 12. Indicators of behavior sent by BAD to MaxPatrol SIEM
Case 3. BAD as a second opinion and ranking system for triggered correlation rules using bad.risk_score
The third case is an incident where a user’s computer was attacked using a malicious office file. The PowerShell script launched from this document downloaded and activated a number of malicious components, one of which served as a proxy server and channel to further compromise the system. The attacker carried out reconnaissance of the node and moved laterally inside the perimeter to gain access to several computers on the network. Figure 13 shows the event diagram.
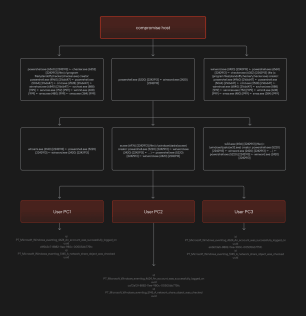
Figure 13. ss.exe activity
Let’s look at the correlation rules in this case with a high bad.risk_score value. In Figure 14, we filtered out all the high-risk triggers (according to BAD).
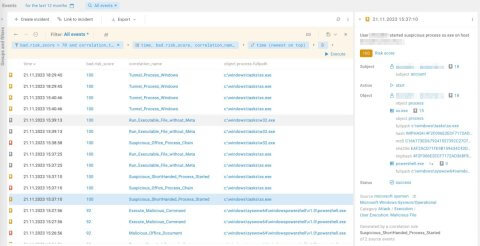
Figure 14. Correlation rules with a high risk score triggered
This illegitimate activity also triggered several correlation rules and indicators of behaviour (Fig. 15).
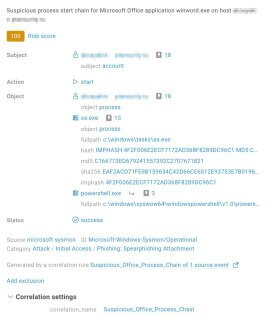
Figure 15. Correlated event card with a risk score from BAD
So which machine learning models were triggered and why did this activity have a high risk score? Figure 16 shows a list of triggered models, and I’ll explain a few of them.
- Suspicious chain of process launches (Windows).
MaxPatrol SIEM can build chains of launched processes. We have a pre-trained model that was trained and continues to be trained on process chains.
- Atypical target node for the process (Windows).
This model looks for anomalous processes authorizing in the Windows operating system. If the activity is anomalous, the model will be triggered.
- Atypical process for users (Windows).
This model looks for processes unique to users launched on a node and warns that the process was not used in training.
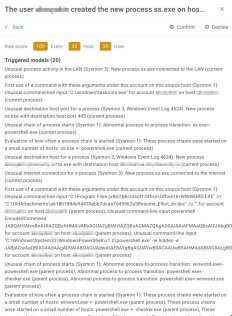
Figure 16. List of models triggered from ss.exe activity
Indicators of behaviour were formed based on the triggered atomic models (Fig. 17) and used to generate the final risk score.
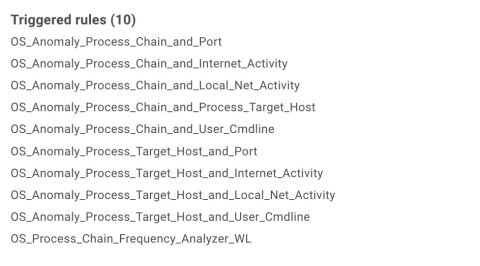
Figure 17. Indicators of behavior triggered
The BAD module identifies the features of processes. Figure 18 shows a detected feature: this illegitimate activity contains a process that behaves like a proxy server.
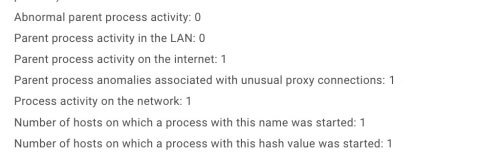
Figure 18. A list of features
Ultimately, BAD identified this anomalous activity, most notably the non-standard use of a process acting as a proxy server. Filtering the correlation rule triggers by bad.risk_score also made it possible to find the necessary triggers fast and detect the incident quickly.
Case 4. BAD as a tool to spot attacks not detected by traditional monitoring tools and operator errors due to excessive whitelisting
Imagine that none of the correlation rules in the system were triggered for the previous activity, or an inexperienced operator wrote a broad regulation and whitelisted a bunch of correlation rules.
Built on alternative detection methods, BAD sends the triggered indicators of behaviour to MaxPatrol SIEM, where we aggregate all the triggers in a process GUID and calculate the total weight of all rules. Then we find the most anomalous processes, which are the exact processes that were so important in the previous case. The analysed activity also includes many different types of events throughout the entire chain of processes.
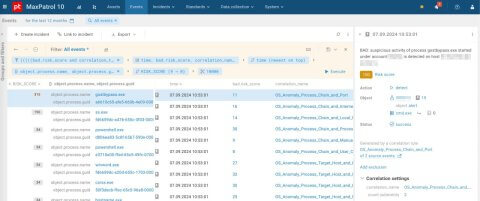
Figure 19. The most anomalous processes in MaxPatrol SIEM
Integration with the MaxPatrol O2 metaproduct
Integration of the BAD module with MaxPatrol O2 (Fig. 20), which builds attack chains automatically, is a perfect complement to the metaproduct’s threat detection methods.
Synergy is attained two ways:
- BAD creates its own alerts to help not miss attacks that aren’t detected by traditional monitoring tools.
- MaxPatrol O2 joins alerts from BAD into a single attack context formed by the metaproduct using linking and enrichment algorithms. This helps move from analysing atomic alerts to analysing the attack chain. Alerts from BAD are also taken into account. We describe this process in more detail
The more complete the attack context, the more accurate MaxPatrol O2’s verdict is about the activity. It’s obvious that it’s easier to make a decision about a suspicious connection to an external node when you can see the entire chain of events that led to the connection and what immediately followed. For example, the creation of files, user authorizations in the system, lateral movement, and much more. Fuller attack context also makes it possible to localize the incident by finding the starting point and responding in a way that makes it impossible for the attacker to continue the attack.
When BAD and MaxPatrol O2 work together, attack detection accuracy improves. Events are analysed in BAD and its verdicts scored in the metaproduct’s scoring model. This reduces the number of false positive chain verdicts as in Case 1, where correlations with importance = high were scored as low risk by the BAD module.
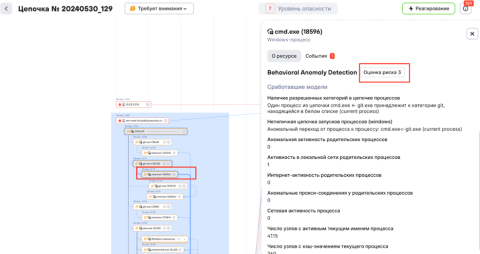
Figure 20. BAD integration with MaxPatrol O2
Future plans
It’s no secret that machine learning is quickly becoming a powerful tool in detecting attacks. In SIEM systems, ML algorithms help analysts investigate incidents and speed up the detection of anomalies and attacks that may go unnoticed by traditional detection methods based on indicators of compromise (IoC) or indicators of attack (IoA).
Risk scores in BAD improve threat response accuracy and speed, help SOC teams optimize detection processes, and most importantly, reduce the time required to neutralize incidents.
We’ll also improve atomic models and develop new indicators of attacker behaviour to more accurately identify anomalies and characteristic signs of hacker activity.
We also see tremendous potential in creating a single, comprehensive model that describes hacker behaviour as a whole. It will be trained on a wide dataset including real cyberincidents from our customers and insights from cyberexercises and projects, including Standoff. Positive Technologies has unique resources at its disposal to collect this data, allowing us to constantly improve and retrain our model.
Combining multiple atomic models and behaviour indicators in a large-scale analytical solution will open a new world of proactive protection against cyberattacks. Also investments in machine learning and artificial intelligence will propel cybersecurity to new heights and provide our customers with the best protection in a constantly changing digital world.
[1] Interactive attacks are different from automated attacks. For example, they require attackers to analyse the company’s internal infrastructure, gain access to credentials, and carry out other actions to move around the network. The purpose of detection mechanisms is to identify interactive attacks before they trigger non-tolerable events.
Image Credit: Positive Technologies


